classical trajectory simulations of H2 at Si(100)

vibration-translation coupling

Before assessing the degree of coupling between H2 translational and surface (i.e. phonon) degrees of freedom, I wanted to check that energy transfer from translation to molecular vibration could be ignored.

I treat the system classically. I set up a lagrangian $L(s,\dot{s},v,\dot{v})$ in the reaction path coordinate $s$ and the transverse vibrational coordinate $v$. At large molecule-surface separations $s$ becomes simply the molecule-surface distance $z$ while $v$ becomes the mass-scaled H2 bond length coordinate $\tilde{r} \equiv \frac{1}{2} r$, where $r$ is the non-mass-scaled bond length. Coupling between the phonon coordinates and the reaction path coordinate is ignored, i.e. we presume the surfaces continually relaxes to remain in its equilibrium position. The lagrangian is of the form $$ L(s,\dot{s},v,\dot{v}) = \frac{1}{2} m \left( \eta^2(s,v) \dot{s}^2 + \dot{v}^2 \right) - V_s(s) - V_v(s,v) $$ where $m$ is the H2 mass, and $\eta(s,v) \equiv 1 - v C(s)$, where $C(s)$ is the reaction path curvature, and $V_s(s)$ and $V_v(s,v)$ are the translational and vibrational potential energies. The forms of these expressions are given in
Brenig, W., & Pehlke, E. (2008). Reaction dynamics of H2 on Si. Ab initio supported model calculations. Progress in Surface Science 83, pg. 263


I use the fourth-order Runge-Kutta algorithm to integrate the associated Euler-Lagrange equations to get trajectories for given initial conditions. The code defining the potentials and performing the Runge-Kutta integration can be downloaded from the following link:
trajectory code (python)
Below are some animations (note: files are a few MB in size) of the trajectories for various initial conditions.
description file link
desorption download
Etrans = 100 meV, Evib = 0 meV download
Etrans = 710 meV, Evib = 0 meV download
Etrans = 100 meV, Evib = $\frac{1}{2}\hbar\omega$ download
Etrans = 450 meV, Evib = $\frac{1}{2}\hbar\omega$ download
The trajectory animations demonstrate that the program appears to be working correctly and also show that at our beam energies ($\approx$100meV) the translational motion is almost completely decoupled from the vibrational. The animations at higher beam energies, however, show appreciable V-T coupling, as does the animation for the desorbing molecule.
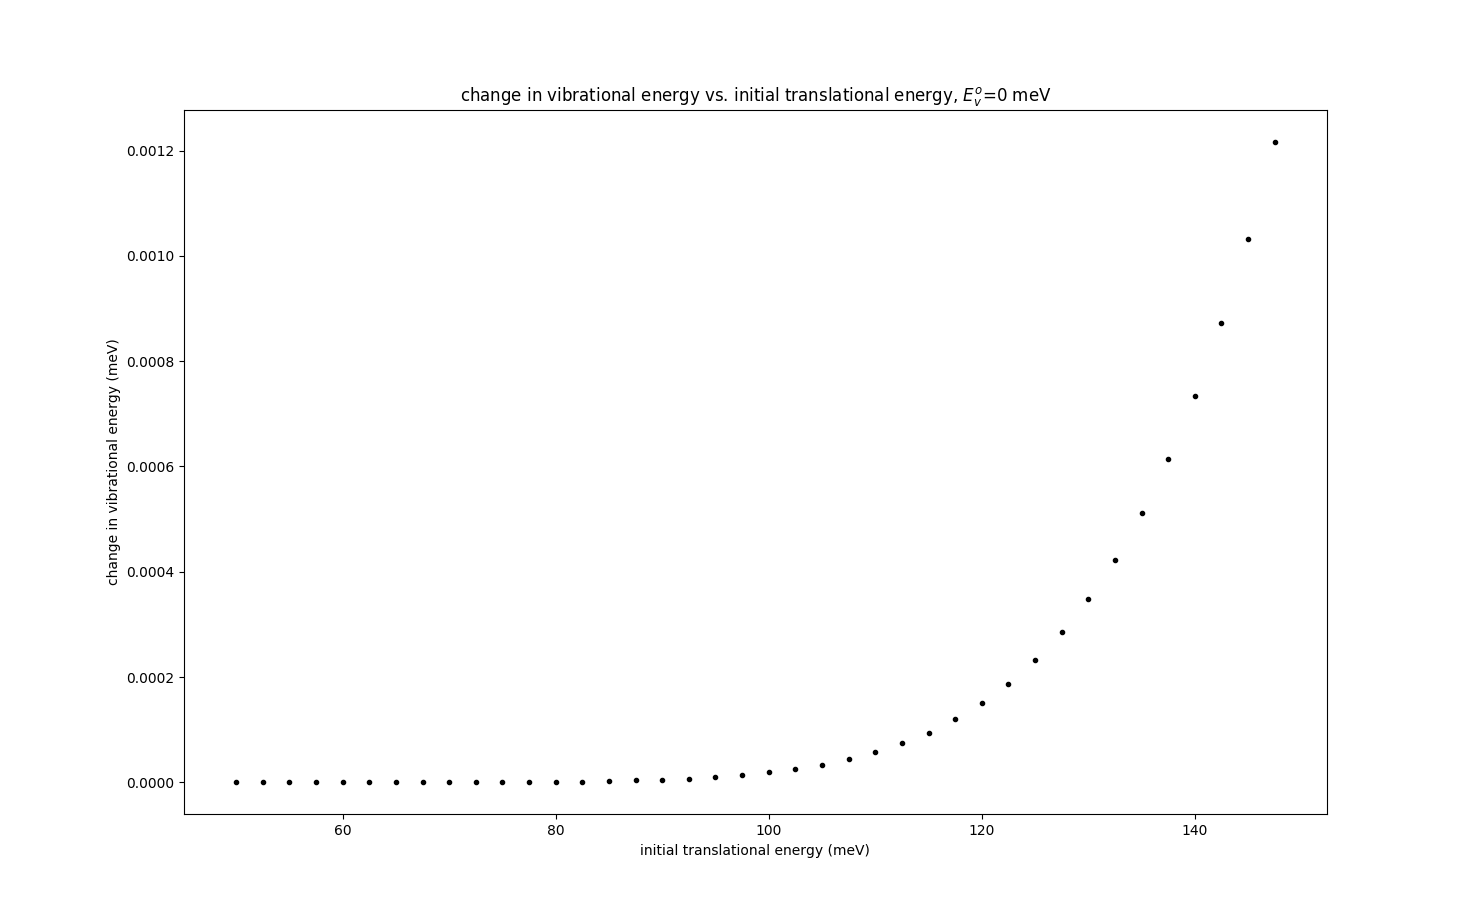
To make this assertion more quantitative, I compute the change in vibrational energy (i.e. translation → vibrational energy transfer) as a function of beam energy and initial vibrational energy. The following plot shows the energy transfer for molecules with no initial vibrational energy. As you can see there is essentially no coupling between the two degrees of freedom.
translational → vibrational energy transfer for initially non-vibrating molecules
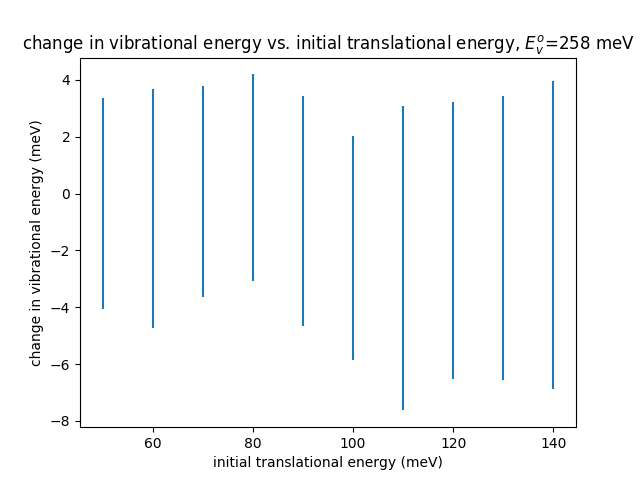
The next figure plots the energy transfer for molecules with zero-point vibrational energy. At each beam energy the trajectory is calculated for twenty random initial phases of vibration. The error bars indicate the standard deviation of the resulting energy transfers. The results show that molecules with zero-point vibrational motion have much larger V-T coupling than the non-vibrating case, though compared to the incident energy the transfer is still quite negligible.
translational → vibrational energy transfer molecules with zero-point vibrational motion

translation-phonon coupling

Having established that translation-vibration coupling can be ignored, we can now look at the influence of surface motion. Below are a few illustrative animations:
description file link
desorption download
Etrans = 100 meV, Ephon = 0 meV download
Etrans = 700 meV, Ephon = 0 meV download
Etrans = 100 meV, Ephon = $\frac{1}{2}\hbar\omega_{pg}$ download
From the animations we see that although coupling in some circumstances can be significant, at our 100 meV beam energy there is very little transfer of translational energy to phonon energy. With the phonon initially at rest the coupling is a few tenths of an eV, though, likeas with the vibrational motion, including zero-point phonon motion (at room temperature the average phonon occupation is near zero) does increase the coupling to a few meV.

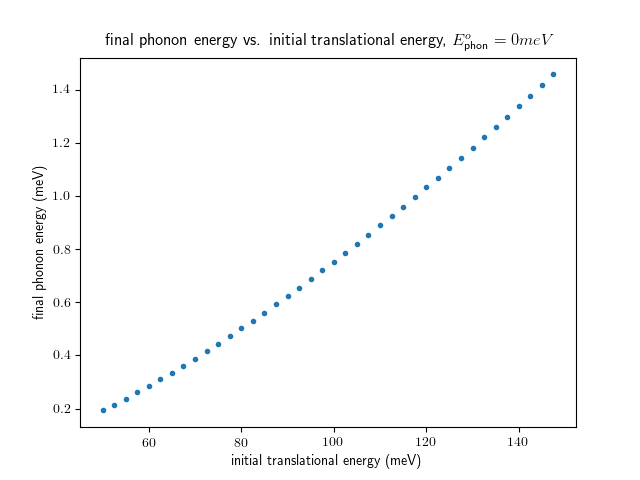
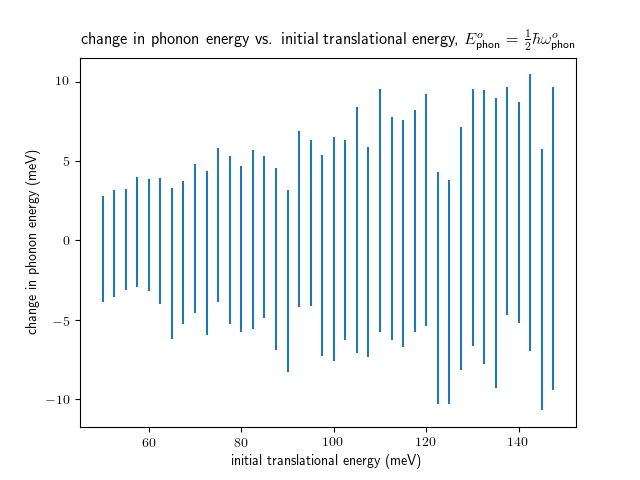
I repeat the same quantitative analysis for the phonon motion that we did for the vibrtaional. The results are presented in the figures below.
translational → phonon energy transfer. phonons begin at rest.
translational → phonon energy transfer. phonons are initialized with zero-point energy.
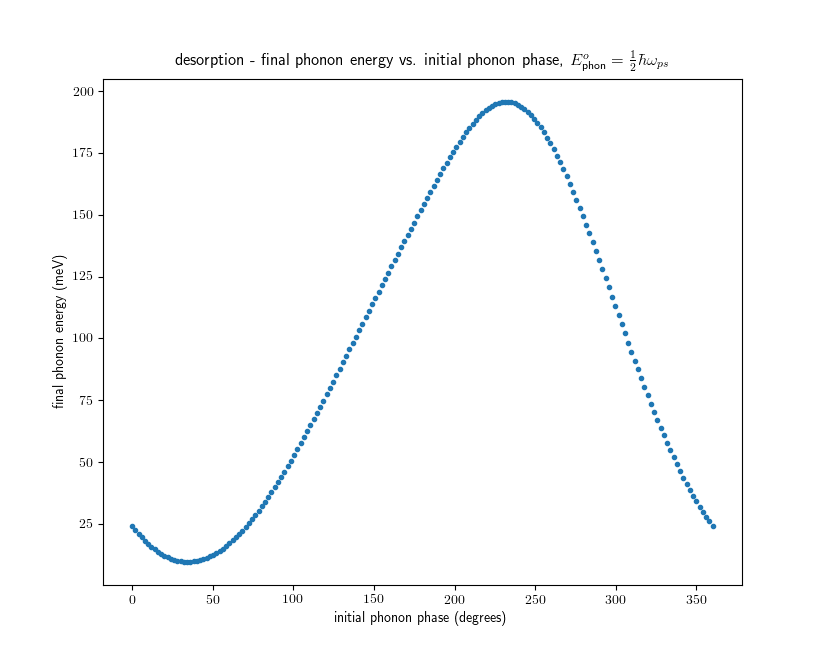
Lastly I calculated some trajectories that look at the H2/Si(100) "barrier puzzle", which is the apparent contradiction of high adsorption barriers and low translational heating upon desorption. The figure below demonstrates that a significant amount of the total potential energy stored in the transition state can be left in the surface motion after the molecules leaves.
translational → phonon energy transfer on desorption. phonons are initialized with zero-point energy. a 0° phase corresponds to the phonon coordinate at rest but displaced from its transition-state equilibrium value towards its gas phase ($z \to \infty$) equilibrium value (to the right on the trajectory plots), while a 90° phase corresponds to the phonon coordinate at its transition-state equilibrium value but moving towards its gas-phase equlibrium value.